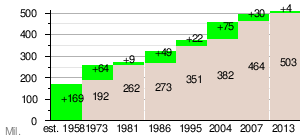
Chart of the population development of the EU affiliated with the enlargement process. |
This is a sequence of tables giving statistical data for past and future enlargements of the European Union. All data refer to the populations, land areas, and gross domestic products (GDP) of the respective countries at the time of their accession to the European Union, illustrating historically accurate changes to the Union. The GDP figures are at purchasing power parity, in United States dollar at 1990 prices.
Further information: Inner Six |
Member countries | Population | Area (km2) | GDP (billion US$) |
GDP per capita (US$) |
---|---|---|---|---|
Belgium | 9,052,707 | 30,528 | 58.316 | $46,878 |
France [1] | 44,788,852 | 674,843 | 312.966 | $40,690 |
West Germany [2] | 54,292,038 | 248,717 | 400.554 | $41,168 |
Italy | 49,476,000 | 301,336 | 265.192 | $30,116 |
Luxembourg | 310,291 | 2,586 | 2.938 | $113,533 |
Netherlands | 11,186,847 | 41,526 | 83.351 | $50,355 |
EC6 (1958) | 169,106,736 | 1,299,536 | 1,123.317 | 6,643 |
Further information: 1973 enlargement of the European Communities |
Member countries | Population | Area (km2) | GDP (billion US$) |
GDP per capita (US$) |
---|---|---|---|---|
Denmark [3] | 5,021,861 | 43,094 | 70.032 | $59,928 |
Ireland | 3,073,200 | 70,273 | 21.103 | $39,638 |
United Kingdom | 56,210,000 | 244,820 | 675.941 | $36,728 |
Accession countries | 64,305,061 | 358,187 | 767.076 | 11,929 |
Existing members (1973) | 192,457,106 | 1,299,536 | 2,381,396 | 12,374 |
EC9 (1973) | 256,762,167 (+33.41%) |
1,657,723 (+25.44%) |
3,148.472 (+32.21%) |
12,262 (−0.91%) |
Further information: 1981 enlargement of the European Communities |
Member countries | Population | Area (km2) | GDP (billion US$) |
GDP per capita (US$) |
---|---|---|---|---|
Greece | 9,729,350 | 131,945 | 86.553 | 8,896 |
Existing members (1981) | 261,743,191 | 1,657,723 | 3,694,558 | 14,115 |
EC10 (1981) | 271,472,541 (+3.72%) |
1,789,668 (+7.96%) |
3,781.111 (+2.34%) |
13,928 (−1.33%) |
Further information: 1986 enlargement of the European Communities |
Member countries | Population | Area (km2) | GDP (billion US$) |
GDP per capita (US$) |
---|---|---|---|---|
Portugal | 9,907,411 | 92,391 | 85.610 | 8,641 |
Spain | 38,707,556 | 504,782 | 386.998 | 9,998 |
Accession countries | 48,614,967 | 597,173 | 472.608 | 9,721 |
Existing members (1986) | 273,398,552 | 1,789,668 | 4,186.176 | 15,312 |
EC12 (1986) EU12 (1993) |
322,013,519 (+17.78%) |
2,386,841 (+33.37%) |
4,658.784 (+11.29%) |
14,468 (−5.51%) |
Further information: German reunification |
Member countries | Population | Area (km2) | GDP (billion US$) |
GDP per capita (US$) |
---|---|---|---|---|
East Germany | 16,111,000 | 108,333 | 159.5 | 9,800 |
Existing members (1986) | 322,013,519 | 2,386,841 | 4,658.784 | 14,468 |
Further information: 1995 enlargement of the European Union |
Member countries | Population | Area (km2) | GDP (billion US$) |
GDP per capita (US$) |
---|---|---|---|---|
Austria | 8,206,524 | 83,871 | 145.238 | 18,048 |
Finland | 5,261,008 | 338,145 | 80.955 | 15,859 |
Sweden | 9,047,752 | 449,964 | 156.640 | 17,644 |
Accession countries | 22,515,284 | 871,980 | 382.833 | 17,378 |
Existing members (1995) | 350,909,402 | 2,495,174 | 5,894.232 | 16,797 |
EU15 (1995) | 373,424,686 (+6.4%) |
3,367,154 (+34.95%) |
6,277.065 (+6.50%) |
16,831 (+0.20%) |
Further information: 2004 enlargement of the European Union |
Member countries | Population | Area (km2) | GDP (billion US$) |
GDP per capita (US$) |
---|---|---|---|---|
Cyprus [4] | 775,927 | 9,250 | 11.681 | 15,054 |
Czech Republic | 10,246,178 | 78,866 | 105.248 | 10,272 |
Estonia | 1,341,664 | 45,226 | 22.384 | 16,684 |
Hungary | 10,032,375 | 93,030 | 102,183 | 10,185 |
Latvia | 2,306,306 | 64,589 | 24.826 | 10,764 |
Lithuania | 3,607,899 | 65,200 | 31.971 | 8,861 |
Malta | 396,851 | 316 | 5.097 | 12,843 |
Poland | 38,580,445 | 311,904 | 316.438 | 8,202 |
Slovakia | 5,423,567 | 49,036 | 42.800 | 7,810 |
Slovenia | 2,011,473 | 20,273 | 29.633 | 14,732 |
Accession countries | 74,722,685 | 737,690 | 685.123 | 9,169 |
Existing members (2004) | 381,781,620 | 3,367,154 | 7,711.871 | 20,200 |
EU25 (2004) | 456,504,305 (+19.57%) |
4,104,844 (+17.97%) |
8,396,994 (+8.88%) |
18,394 (−8.94%) |
Further information: 2007 enlargement of the European Union |
Member countries | Population | Area (km2) | GDP (billion US$) |
GDP per capita (US$) |
---|---|---|---|---|
Bulgaria | 7,761,000 | 111,002 | 62.29 | 8,026 |
Romania | 22,329,977 | 238,391 | 204.4 | 9,153 |
Accession countries | 30,090,977 | 349,393 | 266.69 | 8,863 |
Existing members (2007) | 464,205,901 | 4,104,844 | 12,170.11 | 26,217 |
EU27 (2007) | 494,296,878 (+6.48%) |
4,454,237 (+8.51%) |
12,436.80 (+2.04%) |
25,160.59 (−4.03%) |
Further information: 2013 enlargement of the European Union |
Member countries | Population | Area (km2) | GDP (billion US$) |
GDP per capita (US$) |
---|---|---|---|---|
Croatia | 4,290,612 | 56,594 | 80.983 | 18,338 |
Existing members (2013) | 503,492,041 | 4,454,237 | 15,821.00 | 31,607 |
EU28 (2013) | 506,777,111 (+0.85%) |
4,510,831 (+1.31%) |
15,868.983 (+0.51%) |
31,313.54 (−0.74%) |
Further information: Brexit |
Population | Area (km2) | GDP (billion US$) |
GDP per capita (US$) | |
---|---|---|---|---|
European Union | 447,007,596 | 4,233,262 | 17,046 | 38,134 |
Country | Population | Area (km2) | GDP (billion US$) |
GDP per capita (US$) |
Languages |
---|---|---|---|---|---|
Albania | 2,845,955 | 28,748 | 16.75 | 5,887 | Albanian |
EU27 + Albania | 449,853,551 (+0.64%) |
4,262,010 (+0.68%) |
17,063 (+0.10%) |
37,930 (−0.53%) |
Member countries | Population[2] | Area (km2) | GDP (US$)[3] |
GDP per capita (US$) |
Languages |
---|---|---|---|---|---|
Georgia | 3,688,647 | 69,700 | 30 billion | 8,164 | Georgian |
EU27 | 447,007,596 | 4,233,262 | 17,046 billion | 38,134 | 24 |
EU27+1 | 450,731,931 | 4,302,962 | 17,076 billion | 37,885 | 25 (+1) |
Country | Population | Area (km2) | GDP (billion US$) |
GDP per capita (US$) |
Languages |
---|---|---|---|---|---|
Montenegro | 620,739 | 13,812 | 4.79 | 7,717 | Montenegrin |
EU27 + Montenegro | 449,853,551 (+0.14%) |
4,262,010 (+0.33%) |
17,063 (+0.03%) |
37,930 (-0.11%) |
Country | Population | Area (km2) | GDP (billion US$) |
GDP per capita (US$) |
Languages |
---|---|---|---|---|---|
Moldova | 2,597,100 | 33,846 | 12.40 | 4,773 | Moldovan |
EU27 + Moldova | 449,604,696 (+0.58%) |
4,267,108 (+0.80%) |
17,059 (+0.07%) |
37,942 (-0.51%) |
Country | Population | Area (km2) | GDP (billion US$) |
GDP per capita (US$) |
Languages |
---|---|---|---|---|---|
North Macedonia | 1,836,713 | 25,713 | 13.89 | 7,562 | Macedonian |
EU27 + North Macedonia | 448,844,309 (+0.41%) |
4,258,975 (+0.61%) |
17,060 (+0.08%) |
38,009 (-0.33%) |
Country | Population | Area (km2) | GDP (billion US$) |
GDP per capita (US$) |
Languages |
---|---|---|---|---|---|
Serbia | 6,871,547 | 77,474 | 65.70 | 9,561 | Serbian |
EU27 + Serbia | 453,879,143 (+1.54%) |
4,310,736 (+1.83%) |
17,112 (+0.39%) |
37,702 (-1.13%) |
Country | Population | Area (km2) | GDP (billion US$) |
GDP per capita (US$) |
Languages |
---|---|---|---|---|---|
Turkey | 84,680,273 | 783,356 | 692.38 | 8,176 | Turkish |
EU27 + Turkey | 531,687,869 (+18.94%) |
5,016,618 (+18.50%) |
17,739 (+4.06%) |
33,363 (-12.51%) |
Country | Population | Area (km2) | GDP (billion US$) |
GDP per capita (US$) |
Languages |
---|---|---|---|---|---|
Ukraine | 41,167,336 | 603,628 | 181 | 4,397 | Ukrainian |
EU27 + Ukraine | 488,174,932 (+9.21%) |
4,836,890 (+14.26%) |
17,227 (+1.06%) |
35,289 (-7.46%) |
Countries | Population | Area (km2) | GDP (billion US$) |
GDP per capita (US$) |
---|---|---|---|---|
Albania Moldova Montenegro North Macedonia Serbia Turkey Ukraine |
140,619,663 | 1,566,577 | 986.91 | 7,018 |
EU33 | 587,627,259 (+31.46%) |
5,799,839 (+37.01%) |
18,033 (+5.79%) |
30,688 (-19.53%) |
Note: All data sourced from individual country entries on Wikipedia. Populations usually 2021 estimates; historical/future estimates not used. Figures are approximate due to fluctuations in population and economies.