| Timeline of the 2023 Pacific hurricane season | |||||
|---|---|---|---|---|---|
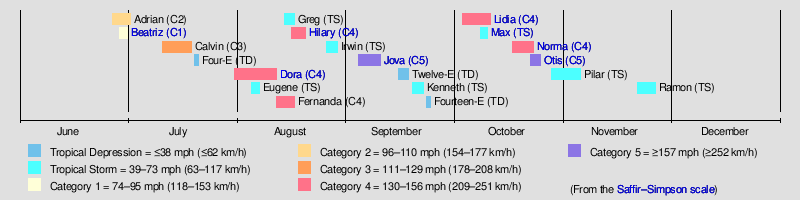
 Season summary map | |||||
| Season boundaries | |||||
| First system formed | June 27, 2023 | ||||
| Last system dissipated | November 26, 2023 | ||||
| Strongest system | |||||
| Name | Otis | ||||
| Maximum winds | 165 mph (270 km/h) | ||||
| Lowest pressure | 922 mbar (hPa; 27.23 inHg) | ||||
| Longest lasting system | |||||
| Name | Dora | ||||
| Duration | 11.5[nb 1] days | ||||
| |||||
The 2023 Pacific hurricane season was a fairly active Pacific hurricane season. In the eastern Pacific basin (east of 140°W), 17 named storms formed; 10 of those became hurricanes, and 8 further intensified into major hurricanes (category 3 or higher on the 5-level Saffir–Simpson wind speed scale). In the central Pacific basin (between 140°W and the International Date Line), no tropical cyclones formed (for the fourth consecutive season), though four entered into the basin from the east.[1][2] The season officially began on May 15, 2023, in the eastern Pacific, and on June 1 in the central Pacific; it ended in both on November 30. These dates, adopted by convention, historically describe the period in each year when most tropical cyclogenesis occurs in these regions of the Pacific.[3] The season's first system, Tropical Storm Adrian, developed on June 27, and its last, Tropical Storm Ramon, dissipated on November 26.
This timeline documents tropical cyclone formations, strengthening, weakening, landfalls, extratropical transitions, and dissipations during the season. It includes information that was not released throughout the season, meaning that data from post-storm reviews by the National Hurricane Center, such as a storm that was not initially warned upon, has been included.
By convention, meteorologists use one time zone when issuing forecasts and making observations: Coordinated Universal Time (UTC), and also use the 24-hour clock (where 00:00 = midnight UTC).[4] Tropical cyclone advisories in the Eastern North Pacific basin use both UTC and the nautical time zone where the center of the tropical cyclone is currently located. Time zones utilized (east to west) are: Central, Mountain, Pacific and Hawaii. In this timeline, all information is listed by UTC first, with the respective regional time zone included in parentheses. Additionally, figures for maximum sustained winds and position estimates are rounded to the nearest 5 units (knots, miles, or kilometers), following National Hurricane Center practice. Direct wind observations are rounded to the nearest whole number. Atmospheric pressures are listed to the nearest millibar and nearest hundredth of an inch of mercury.