District result maps
-
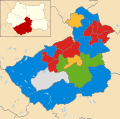
 2006 results map
 -
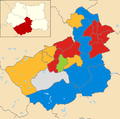
 2007 results map
 -
 2008 results map
 -
 2010 results map
 -
 2011 results map
 -
 2012 results map
 -
 2014 results map
 -
 2015 results map
 -
 2016 results map
Kirklees Council is the local authority for the metropolitan borough of Kirklees in West Yorkshire, England. Since the last boundary changes in 2004, the council has comprised 69 councillors representing 23 wards. Elections are held three years out of four, with one third of the councillors (one for each ward) elected each time for a four-year term.[1]
| Election | Labour | Conservative | Liberal Democrat/Liberal | UKIP | Green | Independent | Other | Control |
|---|---|---|---|---|---|---|---|---|
| 1973[2] | 45 | 14 | 8 | 0 | 0 | 1 | 0 | Labour |
| 1975[3] | 36 | 28 | 7 | 0 | 0 | 1 | 0 | Labour hold |
| 1976[4] | 25 | 50 | 9 | 0 | 0 | 0 | 0 | Conservative gain from Labour |
| 1978[5] | 15 | 48 | 9 | 0 | 0 | 0 | 0 | Conservative hold |
| 1979[6] | 32 | 35 | 5 | 0 | 0 | 0 | 0 | Conservative lose to no overall control |
| 1980[7] | 44 | 25 | 3 | 0 | 0 | 0 | 0 | Labour gain from no overall control |
| 1982[8][9] | 37 | 19 | 12 | 0 | 0 | 0 | 4 | Labour hold |
| 1983[10] | 37 | 20 | 12 | 0 | 0 | 0 | 3 | Labour hold |
| 1984[11] | 37 | 18 | 14 | 0 | 0 | 0 | 3 | Labour hold |
| 1986[12] | 36 | 18 | 17 | 0 | 0 | 1 | 0 | Labour hold |
| 1987[13] | 33 | 21 | 18 | 0 | 0 | 0 | 0 | Labour lose to no overall control |
| 1988[14] | 33 | 23 | 15 | 0 | 0 | 1 | 0 | No overall control |
| 1990[15] | 45 | 15 | 12 | 0 | 0 | 0 | 0 | Labour gain from no overall control |
| 1992[16] | 41 | 19 | 10 | 0 | 0 | 2 | 0 | Labour hold |
| 1994[17] | 35 | 21 | 15 | 0 | 0 | 1 | 0 | Labour lose to no overall control |
| 1995[18] | 40 | 16 | 14 | 0 | 0 | 2 | 0 | Labour gain from no overall control |
| 1996[19] | 45 | 6 | 18 | 0 | 1 | 1 | 1 vacancy | Labour hold |
| 1998[20] | 43 | 7 | 20 | 0 | 2 | 0 | 0 | Labour hold |
| 1999[21] | 36 | 10 | 23 | 0 | 3 | 0 | 0 | Labour lose to no overall control |
| 2000[22] | 25 | 15 | 29 | 0 | 3 | 0 | 0 | No overall control |
| 2002[23] | 26 | 15 | 28 | 0 | 3 | 0 | 0 | No overall control |
| 2003[24] | 22 | 16 | 31 | 0 | 3 | 0 | 0 | No overall control |
| 2004[25] | 17 | 22 | 25 | 0 | 3 | 1 | 1 | No overall control |
| 2006[26] | 20 | 21 | 20 | 0 | 3 | 1 | 4 | No overall control |
| 2007[27] | 22 | 20 | 18 | 0 | 4 | 1 | 4 | No overall control |
| 2008[28] | 22 | 21 | 19 | 0 | 4 | 0 | 3 | No overall control |
| 2010[29] | 24 | 19 | 20 | 0 | 4 | 2 | 0 | No overall control |
| 2011[30] | 27 | 21 | 14 | 0 | 4 | 3 | 0 | No overall control |
| 2012[31] | 32 | 18 | 10 | 0 | 5 | 4 | 0 | No overall control |
| 2014[32] | 32 | 18 | 10 | 0 | 5 | 4 | 0 | No overall control |
| 2015[33] | 34 | 18 | 10 | 0 | 4 | 3 | 0 | No overall control |
| 2016[34] | 34 | 20 | 9 | 0 | 3 | 3 | 0 | No overall control |
| 2018[35] | 36 | 20 | 7 | 0 | 3 | 3 | 0 | Labour gain from no overall control |
| 2019[36] | 35 | 17 | 10 | 0 | 3 | 4 | 0 | Labour hold |
| 2021 | 33 | 19 | 9 | 0 | 3 | 3 | 2[a] | Labour lose to no overall control |
| 2022 | 36 | 18 | 8 | 0 | 3 | 4 | 0 | Labour gain from no overall control |
| 2023 | 39 | 18 | 8 | 0 | 3 | 1 | 0 | Labour hold |


| Party | Candidate | Votes | % | ±% | |
|---|---|---|---|---|---|
| Labour | 1,558 | 48.9 | |||
| Liberal Democrats | 1,179 | 37.0 | |||
| Conservative | 375 | 11.7 | |||
| Green | 73 | 2.3 | |||
| Majority | 377 | 11.9 | |||
| Turnout | 3,185 | ||||
| Labour hold | Swing | ||||
| Party | Candidate | Votes | % | ±% | |
|---|---|---|---|---|---|
| Liberal Democrats | 2,077 | 50.6 | |||
| Labour | 1,418 | 34.5 | |||
| Conservative | 486 | 11.8 | |||
| Green | 124 | 3.0 | |||
| Majority | 659 | 16.1 | |||
| Turnout | 4,105 | 38.2 | |||
| Liberal Democrats hold | Swing | ||||
| Party | Candidate | Votes | % | ±% | |
|---|---|---|---|---|---|
| Labour | 1,219 | 55.5 | +1.7 | ||
| Conservative | 710 | 32.3 | -3.5 | ||
| Liberal Democrats | 268 | 12.2 | +6.2 | ||
| Majority | 509 | 23.2 | |||
| Turnout | 2,197 | 16.0 | |||
| Labour gain from Conservative | Swing | ||||
| Party | Candidate | Votes | % | ±% | |
|---|---|---|---|---|---|
| Liberal Democrats | 1,236 | 43.8 | +31.3 | ||
| Labour | 1,039 | 36.8 | -16.6 | ||
| Conservative | 456 | 16.2 | -9.2 | ||
| Socialist Labour | 90 | 3.2 | +0.3 | ||
| Majority | 197 | 7.0 | |||
| Turnout | 2,821 | 25.1 | |||
| Liberal Democrats gain from Labour | Swing | ||||
| Party | Candidate | Votes | % | ±% | |
|---|---|---|---|---|---|
| Liberal Democrats | 1,174 | 43.4 | -13.1 | ||
| Labour | 976 | 36.0 | +13.3 | ||
| Conservative | 518 | 19.1 | +3.4 | ||
| Socialist | 40 | 1.5 | +1.5 | ||
| Majority | 198 | 7.4 | |||
| Turnout | 2,708 | 21.4 | |||
| Liberal Democrats hold | Swing | ||||
| Party | Candidate | Votes | % | ±% | |
|---|---|---|---|---|---|
| Conservative | 3,176 | 41.2 | -14.6 | ||
| Labour | 2,892 | 37.5 | +3.8 | ||
| Liberal Democrats | 1,651 | 21.4 | +13.6 | ||
| Majority | 284 | 3.7 | |||
| Turnout | 7,719 | ||||
| Liberal Democrats hold | Swing | ||||
| Party | Candidate | Votes | % | ±% | |
|---|---|---|---|---|---|
| BNP | David Exley | 1,607 | 27.7 | +27.7 | |
| Liberal Democrats | Tabasum Aslam | 1,493 | 25.8 | +3.9 | |
| Independent | Tim Crowther | 1,147 | 19.8 | +19.8 | |
| Labour | Florence Smith | 982 | 16.9 | -22.9 | |
| Conservative | Roger Roberts | 490 | 8.5 | -22.9 | |
| Green | Heidi Smithson | 76 | 1.3 | -5.6 | |
| Majority | 114 | 1.9 | |||
| Turnout | 5,795 | 43.8 | |||
| BNP gain from Labour | Swing | ||||
| Party | Candidate | Votes | % | ±% | |
|---|---|---|---|---|---|
| Labour | Barbara Jones | 2,904 | 63.5 | +6.5 | |
| Liberal Democrats | John O'Reilly | 814 | 17.8 | -0.7 | |
| Conservative | Paul Murphy | 287 | 6.3 | -4.1 | |
| Green | Paul Cooney | 240 | 5.3 | -2.1 | |
| Respect | David Ellis | 178 | 3.9 | +3.9 | |
| BNP | Barry Fowler | 148 | 3.2 | -3.5 | |
| Majority | 2,090 | 45.7 | |||
| Turnout | 4,571 | 35.1 | |||
| Labour hold | Swing | ||||
| Party | Candidate | Votes | % | ±% | |
|---|---|---|---|---|---|
| Labour | Peter Daniel McBride | 1,397 | 40.5 | +10.0 | |
| Liberal Democrats | Alison Louise Munro | 1,155 | 33.5 | -0.8 | |
| Conservative | Martin James Leonard | 605 | 17.5 | -1.9 | |
| BNP | Jonathan David Baxter Wright | 157 | 4.5 | -6.3 | |
| Green | David William Hargreaves | 103 | 3.0 | -2.0 | |
| Independent | Colin Anthony Walder | 34 | 1.0 | +1.0 | |
| Majority | 242 | 7.0 | |||
| Turnout | 3,451 | 27.5 | |||
| Labour hold | Swing | ||||
| Party | Candidate | Votes | % | ±% | |
|---|---|---|---|---|---|
| Labour | Cathy Scott | 1,513 | 37.4 | -2.0 | |
| Liberal Democrats | Dennis Hullock | 1,405 | 34.8 | +14.3 | |
| BNP | Joe Barber | 690 | 17.1 | -10.6 | |
| Conservative | Amelia Lynne Bolton | 345 | 8.5 | -3.9 | |
| Green | Adrian Hugh Cruden | 58 | 1.4 | N/A | |
| Independent | Safiq Ali Patel | 17 | 0.4 | N/A | |
| Independent | Alan Girvan | 15 | 0.4 | N/A | |
| Majority | 108 | 2.7 | |||
| Turnout | 4,043 | 31.0 | |||
| Labour gain from BNP | Swing | ||||
| Party | Candidate | Votes | % | ±% | |
|---|---|---|---|---|---|
| Labour | Simon Alvy | 1,517 | 43.4 | ||
| Conservative | Sharon Light | 1.378 | 39.4 | ||
| Liberal Democrats | Richard Farnhill | 599 | 17.1 | ||
| Majority | 139 | 4.0 | |||
| Turnout | 3,494 | 25.3 | |||
| Labour gain from Conservative | Swing | ||||
| Party | Candidate | Votes | % | ±% | |
|---|---|---|---|---|---|
| Liberal Democrats | Christine Mary Iredale | 1,591 | 47.6 | ||
| Labour | Stephan Georg Jungnitz | 901 | 27.0 | ||
| UKIP | Gregory Lloyd Broome | 450 | 13.5 | ||
| Green | Daniel Edward Greenwood | 210 | 6.3 | ||
| Conservative | Clinton Noel Simpson | 189 | 5.7 | ||
| Majority | 690 | 20.7 | |||
| Turnout | 3,341 | 23.0 | |||
| Liberal Democrats gain from Labour | Swing | ||||
| Party | Candidate | Votes | % | ±% | |
|---|---|---|---|---|---|
| Labour | Habiban Nisa Zaman | 2,640 | 76.8 | ||
| Conservative | Paul Young | 443 | 12.9 | ||
| Independent | Aleks Lukic | 140 | 4.1 | ||
| Liberal Democrats | Jon Robert Bloom | 136 | 4.0 | ||
| Green | David Michael Smith | 70 | 2.0 | ||
| Majority | 2,197 | 63.9 | |||
| Turnout | 3,437 | 25.9 | |||
| Labour hold | Swing | ||||
| Party | Candidate | Votes | % | ±% | |
|---|---|---|---|---|---|
| Labour | Will Simpson | 1,834 | 46.7 | ||
| Conservative | Paula Kemp | 1,689 | 43.0 | ||
| Liberal Democrats | Alison Baskeyfield | 289 | 7.4 | ||
| Green | Isabel Walters | 116 | 3.0 | ||
| Majority | 145 | 3.7 | |||
| Turnout | 3,928 | ||||
| Labour gain from Conservative | Swing | ||||
| Party | Candidate | Votes | % | ±% | |
|---|---|---|---|---|---|
| Conservative | Donna Bellamy | 4,504 | 45.8 | ||
| Labour | Duggs Carre | 3,308 | 46.7 | ||
| Liberal Democrats | Robert Iredale | 1,386 | 14.1 | ||
| Green | Ian Vincent | 646 | 6.6 | ||
| Majority | 1,196 | 12.1 | |||
| Turnout | 9,844 | ||||
| Conservative gain from Labour | Swing | ||||
| Party | Candidate | Votes | % | ±% | |
|---|---|---|---|---|---|
| Labour | Eric Firth | 3,299 | 42.0 | ||
| Conservative | Keith Mallinson | 2,669 | 33.9 | ||
| Heavy Woollen Independents | Ian Vincent | 1,515 | 19.3 | ||
| Liberal Democrats | Dennis Hullock | 380 | 4.8 | ||
| Majority | 630 | 8.0 | |||
| Turnout | 7,863 | ||||
| Labour hold | Swing | ||||
| Party | Candidate | Votes | % | ±% | |
|---|---|---|---|---|---|
| Labour | Ebrahim Dockrat | 2,248 | 73.7 | +29.4 | |
| Conservative | Beverley Smith | 413 | 13.5 | -30.5 | |
| Liberal Democrats | Stephen Long | 178 | 5.8 | -0.1 | |
| Green | Simon Duffy | 145 | 4.8 | -3.9 | |
| Yorkshire | Bikatshi Katenga | 42 | 1.4 | +1.4 | |
| SDP | Mark Steele | 24 | 0.8 | +0.8 | |
| Majority | 1,835 | 60.2 | |||
| Turnout | 3,050 | ||||
| Labour hold | Swing | ||||
