Borough result maps
-
 2000 results map
 -
 2002 results map
 -
 2003 results map
 -
 2004 results map
 -
 2006 results map
 -
 2007 results map
 -
 2008 results map
 -
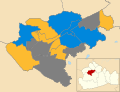
 2010 results map
 -
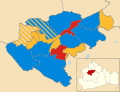
 2021 results map
One third of Woking Borough Council in Surrey, England is elected each year, followed by one year without election. Since the last boundary changes in 2016, 30 councillors have been elected from 10 wards.[1]
A borough called Woking had existed since 1974 and was controlled by the Conservative Party until the local elections in 1986. The partisan control of the borough has been as follows, with each poll electing one third of the seats, except where noted.[2][3]
| Election | Party in control | Contested | Refs | |
|---|---|---|---|---|
| 2023 | Liberal Democrats | 10 of 30 | [4] | |
| 2022 | Liberal Democrats | 10 of 30 | [5] | |
| 2021 | No overall control | 10 of 30 | [6] | |
| 2019 | 10 of 30 | [7][8] | ||
| 2018 | Conservative | 10 of 30 | [9][10] | |
| 2016FW | 30 of 30 | [11][12] | ||
| 2015 | 12 of 36 | [13] | ||
| 2014 | 12 of 36 | [14] | ||
| 2012 | 12 of 36 | [15] | ||
| 2011 | 13 of 36 | [15] | ||
| 2010 | No overall control | 13 of 36 | [15] | |
| 2009* | — | [2] | ||
| 2008 | Conservative | 12 of 36 | [15] | |
| 2007 | 12 of 36 | [15] | ||
| 2006 | No overall control | 13 of 36 | [15] | |
| 2004 | 13 of 36 | [15] | ||
| 2003 | 13 of 36 | [15] | ||
| 2002 | 13 of 36 | [15] | ||
| 2000FW | 36 of 36 | [15][16][17] | ||
| 1999 | 12 of 35 | [15] | ||
| 1998 | 11 of 35 | [15] | ||
| 1996 | Liberal Democrats | 12 of 35 | [15] | |
| 1995 | No overall control | 12 of 35 | [15] | |
| 1994 | 11 of 35 | [15] | ||
| 1992 | Conservative | 12 of 35 | [15] | |
| 1991 | No overall control | 12 of 35 | [15] | |
| 1990 | 12 of 35 | [15] | ||
| 1988 | 15 of 35 | [15] | ||
| 1987 | 12 of 35 | [15] | ||
| 1986B | 12 of 35 | [15][18] | ||
| 1984 | Conservative | 12 of 35 | [15] | |
| 1983 | 13 of 35 | [15] | ||
| 1982 | 11 of 35 | [15] | ||
| 1980 | 12 of 35 | [15] | ||
| 1979B | 12 of 35 | [15][19] | ||
| 1978 | 12 of 35 | [15] | ||
| 1976FW | 35 of 35 | [15][20] | ||
| 1973BF | 34 of 34 | [15] | ||
| B: New borough boundaries F: Full borough election W: New ward boundaries *: Change in control without election | ||||


| Party | Candidate | Votes | % | ±% | |
|---|---|---|---|---|---|
| Liberal Democrats | 927 | 60.6 | |||
| Conservative | 318 | 20.8 | |||
| Labour | 228 | 14.9 | |||
| UKIP | 58 | 3.8 | |||
| Majority | 609 | 39.8 | |||
| Turnout | 1,531 | ||||
| Liberal Democrats hold | Swing | ||||
| Party | Candidate | Votes | % | ±% | |
|---|---|---|---|---|---|
| Liberal Democrats | 626 | 52.2 | +2.4 | ||
| Conservative | 357 | 29.8 | +3.6 | ||
| Labour | 217 | 18.1 | -5.9 | ||
| Majority | 269 | 22.4 | |||
| Turnout | 1,200 | 21.0 | |||
| Liberal Democrats hold | Swing | ||||
| Party | Candidate | Votes | % | ±% | |
|---|---|---|---|---|---|
| Independent | 652 | 34.5 | +34.5 | ||
| Conservative | 545 | 28.9 | -9.0 | ||
| Liberal Democrats | 442 | 23.4 | -16.9 | ||
| Labour | 249 | 13.2 | -8.6 | ||
| Majority | 107 | 5.6 | |||
| Turnout | 1,888 | 24.0 | |||
| Independent gain from Liberal Democrats | Swing | ||||
| Party | Candidate | Votes | % | ±% | |
|---|---|---|---|---|---|
| Conservative | 1,426 | 56.3 | -0.1 | ||
| Liberal Democrats | 942 | 37.2 | +1.3 | ||
| Labour | 164 | 6.5 | -1.3 | ||
| Majority | 484 | 19.1 | |||
| Turnout | 2,532 | 39.9 | |||
| Conservative hold | Swing | ||||
| Party | Candidate | Votes | % | ±% | |
|---|---|---|---|---|---|
| Conservative | Beryl Marlow | 809 | 53.6 | +15.6 | |
| Liberal Democrats | Anne Roberts | 557 | 36.9 | -14.8 | |
| Labour | Raymond Holroyde | 144 | 9.5 | -0.8 | |
| Majority | 252 | 16.7 | |||
| Turnout | 1,510 | 27.5 | |||
| Conservative gain from Liberal Democrats | Swing | ||||
| Party | Candidate | Votes | % | ±% | |
|---|---|---|---|---|---|
| Conservative | Rashid Mohammed | 1,057 | 44.1 | +22.6 | |
| Labour | Stephen Tudhope | 833 | 34.8 | +1.2 | |
| UKIP | Neil Willetts | 255 | 10.6 | -0.2 | |
| Liberal Democrats | Norman Johns | 252 | 10.5 | -23.6 | |
| Majority | 224 | 9.3 | |||
| Turnout | 2,397 | ||||
| Conservative gain from Liberal Democrats | Swing | ||||
| Party | Candidate | Votes | % | ±% | |
|---|---|---|---|---|---|
| Liberal Democrats | James Sanderson | 594 | 37.8 | +13.9 | |
| Conservative | Sonia Elbaraka | 562 | 35.8 | -8.5 | |
| Labour | James Butcher | 262 | 16.7 | -4.6 | |
| UKIP | Tim Read | 154 | 9.8 | -0.7 | |
| Majority | 32 | 2.0 | |||
| Turnout | 1,572 | ||||
| Liberal Democrats hold | Swing | ||||
| Party | Candidate | Votes | % | ±% | |
|---|---|---|---|---|---|
| Conservative | Chitra Rana | 367 | 40.0 | +7.0 | |
| Liberal Democrats | Tina Liddington | 349 | 38.0 | +0.3 | |
| Labour | Robina Shaheen | 105 | 11.4 | +1.2 | |
| UKIP | Troy de Leon | 97 | 10.6 | -8.6 | |
| Majority | 18 | 2.0 | |||
| Turnout | 918 | ||||
| Conservative gain from Liberal Democrats | Swing | ||||