Timeline of the
2011 Atlantic hurricane season
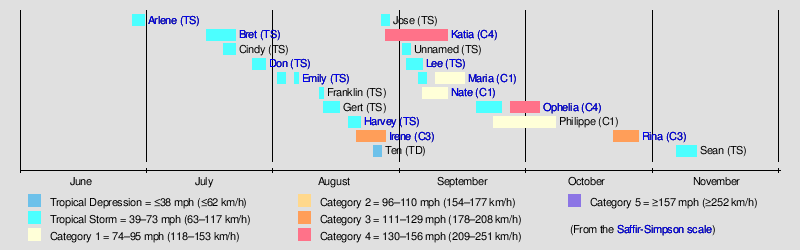
A map of the tracks of all the storms of the 2011 Atlantic hurricane season
Season summary map
Season boundaries
First system formedJune 28, 2011
Last system dissipatedNovember 11, 2011
Strongest system
NameOphelia
Maximum winds140 mph (220 km/h)
(1-minute sustained)
Lowest pressure940 mbar (hPa; 27.76 inHg)
Longest lasting system
NamePhilippe
Duration14 days
Storm articles
Other years
2009, 2010, 2011, 2012, 2013

The 2011 Atlantic hurricane season was an event in the annual hurricane season in the north Atlantic Ocean. It was well above average, with 19 tropical storms forming.[nb 1] Even so, it was the first season on record in which the first eight storms failed to attain hurricane strength. The season officially began on June 1, 2011, and ended on November 30, 2011, dates that conventionally delimit the period of each year when most tropical cyclones develop in the Atlantic basin.[2] The season's first storm, Tropical Storm Arlene did not form until June 28. The final storm to develop, Tropical Storm Sean, dissipated on November 11.

There were 19 named storms altogether during the season, including seven hurricanes of which three intensified into major hurricanes.[nb 2] The two most significant storms, in terms of loss of life and damage, were Hurricane Irene and Tropical Storm Lee. Hurricane Irene was a powerful and unusually large storm that made several landfalls along the East Coast of the United States after peaking with maximum sustained winds of 120 mph (195 km/h).[4] Tropical Storm Lee was a disorganized tropical cyclone that moved ashore into Louisiana before producing historic flooding in the Northeast United States as an extratropical cyclone.[5]

This timeline includes information that was not operationally released, meaning that data from post-storm reviews by the National Hurricane Center, such as a storm that was not operationally warned upon, has been included. This timeline documents tropical cyclone formations, strengthening, weakening, landfalls, extratropical transitions, and dissipations during the season.

By convention, meteorologists use one time zone when issuing forecasts and making observations: Coordinated Universal Time (UTC), and also use the 24-hour clock (where 00:00 = midnight UTC).[6] The National Hurricane Center uses both UTC and the time zone where the center of the tropical cyclone is currently located. The time zones utilized (east to west) prior to 2020 were: Atlantic, Eastern, and Central.[7] In this timeline, all information is listed by UTC first with the respective regional time included in parentheses. Additionally, figures for maximum sustained winds and position estimates are rounded to the nearest 5 units (knots, miles, or kilometers), following the convention used in the National Hurricane Center's products. Direct wind observations are rounded to the nearest whole number. Atmospheric pressures are listed to the nearest millibar and nearest hundredth of an inch of mercury.

Timeline

Hurricane RinaHurricane Ophelia (2011)Hurricane Nate (2011)Hurricane Maria (2011)Tropical Storm Lee (2011)Hurricane Katia (2011)Hurricane IreneTropical Storm Harvey (2011)Tropical Storm Emily (2011)Tropical Storm Don (2011)Tropical Storm Bret (2011)Tropical Storm Arlene (2011)Saffir-Simpson scale

June

A satellite image of a large, swirling mass of clouds making landfall in Mexico
Tropical Storm Arlene after making landfall near Cabo Rojo, Veracruz, as a strong tropical storm
June 1
June 28
June 30

July

July 1
July 17
July 18
July 20
Storm track of a tropical storm that formed east of Florida and moved northeast out to sea
Storm path of Tropical Storm Bret
July 21
July 22
July 23
July 27
July 29
July 30

August

August 2
Satellite imagery of a disorganized tropical cyclone in the Caribbean Sea
Tropical Storm Emily crossing the Windward Islands on August 2
August 3
August 4
August 6
August 7
August 12
August 13
A satellite image of a swirling mass of clouds over the open Atlantic
Tropical Storm Gert spinning over the open Atlantic
August 14
August 15
August 16
August 19
August 20
August 21
A satellite image of the first hurricane of the 2011 Atlantic hurricane season
Irene shortly after being classified as a Category 1 hurricane
August 22
August 24
August 25
August 26
Storm track for a short-lived tropical depression in the Eastern Atlantic
Storm track of Tropical Depression Ten
August 27
August 28
August 29
August 30

September

September 1
September 2
A satellite image depicting a subtropical cyclone prior to making landfall in Louisiana
Satellite imagery of Subtropical Storm Lee shortly before landfall
September 3
September 4
September 5
September 6
September 7
A satellite image depicting a Category 1 hurricane moving towards Newfoundland
Satellite imagery of Maria as a Category 1 hurricane
September 8
September 9
September 10
September 11
September 12
September 15
September 16
September 20
September 21
September 24
A satellite image depicting a well-developed hurricane with a clear eye visible
Hurricane Ophelia at Category 3 strength on October 1
September 25
September 27
September 28
September 29
September 30

October

October 2
October 3
Storm track of a hurricane in the Eastern Atlantic
Storm track of Hurricane Philippe
October 4
October 6
October 7
October 8
October 23
October 24
A satellite image showing Hurricane Rina at peak intensity on October 25
Hurricane Rina at peak intensity
October 25
October 26
October 27
October 28

November

Satellite imagery of Sean as a tropical storm
November 8
November 12
November 30

See also

Notes

  1. ^ An average season, as defined by the National Oceanic and Atmospheric Administration, has twelve tropical storms, six hurricanes and two major hurricanes.[1]
  2. ^ Hurricanes reaching Category 3 (wind speeds of 111 miles per hour (179 km/h)) or higher on the 5-level Saffir–Simpson wind speed scale are considered major hurricanes.[3]

References

  1. ^ "Background Information: North Atlantic Hurricane Season". Climate Prediction Center. Retrieved September 25, 2021.
  2. ^ a b c Dorst, Neal (June 1, 2018). "Hurricane Season Information". Frequently Asked Questions About Hurricanes. Miami, Florida: NOAA Atlantic Oceanographic and Meteorological Laboratory. Retrieved June 29, 2020.
  3. ^ "Saffir–Simpson Hurricane Wind Scale". Miami, Florida: National Hurricane Center. Retrieved June 29, 2020.
  4. ^ a b c d e f g h i j k l m n o p q Lixion A. Avila; John Cangialosi (December 14, 2011). Tropical Cyclone Report: Hurricane Irene (PDF) (Report). National Hurricane Center. Retrieved July 21, 2012.
  5. ^ a b c d e f g Daniel P. Brown (December 15, 2011). Tropical Cyclone Report: Tropical Storm Lee (PDF) (Report). National Hurricane Center. Retrieved July 21, 2012.
  6. ^ "Understanding the Date/Time Stamps". Miami, Florida: NOAA National Hurricane Center. Retrieved July 10, 2020.
  7. ^ "Update on National Hurricane Center Products and Services for 2020" (PDF). Miami, Florida: National Hurricane Center. April 20, 2020. Retrieved May 17, 2020.
  8. ^ a b c d e John L. Beven (December 7, 2011). Tropical Cyclone Report: Tropical Storm Arlene (PDF) (Report). National Hurricane Center. Retrieved July 22, 2012.
  9. ^ a b c d e Stacy R. Stewart (December 5, 2011). Tropical Cyclone Report: Tropical Storm Bret (PDF) (Report). National Hurricane Center. Retrieved July 22, 2012.
  10. ^ a b c d Daniel P. Brown (September 16, 2011). Tropical Cyclone Report: Tropical Storm Cindy (PDF) (Report). National Hurricane Center. Retrieved July 22, 2012.
  11. ^ a b c d e Michael J. Brennan (October 28, 2011). Tropical Cyclone Report: Tropical Storm Don (PDF) (Report). National Hurricane Center. Retrieved July 22, 2012.
  12. ^ a b c d e f Todd B. Kimberlain; John P. Cangialosi (January 13, 2012). Tropical Cyclone Report: Tropical Storm Emily (PDF) (Report). National Hurricane Center. Retrieved July 22, 2012.
  13. ^ a b c d John P. Cangialosi (October 27, 2011). Tropical Cyclone Report: Tropical Storm Franklin (PDF) (Report). National Hurricane Center. Retrieved July 22, 2012.
  14. ^ a b c d Robbie Berg (October 26, 2011). Tropical Cyclone Report: Tropical Storm Gert (PDF) (Report). National Hurricane Center. Retrieved July 22, 2012.
  15. ^ a b c d e f g h i Eric S. Blake (November 30, 2011). Tropical Cyclone Report: Tropical Storm Harvey (PDF) (Report). National Hurricane Center. Retrieved July 22, 2012.
  16. ^ a b Richard J. Pasch (January 4, 2012). Tropical Cyclone Report: Tropical Depression Ten (PDF) (Report). National Hurricane Center. Retrieved July 22, 2012.
  17. ^ a b c d John L. Beven (January 4, 2012). Tropical Cyclone Report: Tropical Storm Jose (PDF) (Report). National Hurricane Center. Retrieved July 22, 2012.
  18. ^ a b c d e f g h i j Stacy R. Stewart (January 16, 2012). Tropical Cyclone Report: Hurricane Katia (PDF) (Report). National Hurricane Center. Retrieved July 22, 2012.
  19. ^ a b c d Eric S. Blake; Todd B. Kimberlain (December 2, 2011). Tropical Cyclone Report: Unnamed Tropical Storm (PDF) (Report). National Hurricane Center. Retrieved July 22, 2012.
  20. ^ a b c d e f g h i Michael J. Brennan (January 11, 2012). Tropical Cyclone Report: Hurricane Maria (PDF) (Report). National Hurricane Center. Retrieved July 22, 2012.
  21. ^ a b c d e f Todd B. Kimberlain (November 11, 2011). Tropical Cyclone Report: Hurricane Nate (PDF) (Report). National Hurricane Center. Retrieved July 22, 2012.
  22. ^ a b c d e f g h i j k l m n John P. Cangialosi (December 8, 2011). Tropical Cyclone Report: Hurricane Ophelia (PDF) (Report). National Hurricane Center. Retrieved July 22, 2012.
  23. ^ a b c d e f g h i j Robbie Berg (January 3, 2012). Tropical Cyclone Report: Hurricane Philippe (PDF) (Report). National Hurricane Center. Retrieved July 22, 2012.
  24. ^ a b c d e f g h i j k Eric S. Blake (January 26, 2012). Tropical Cyclone Report: Hurricane Rina (PDF) (Report). National Hurricane Center. Retrieved July 22, 2012.
  25. ^ a b c Lixion A. Avila (January 12, 2012). Tropical Cyclone Report: Tropical Storm Sean (PDF) (Report). National Hurricane Center. Retrieved July 22, 2012.