Australian federal election results, 2013
The following tables show state-by-state results in the Australian House of Representatives at the 2013 federal election, Coalition 90, Labor 55, Australian Greens 1, Palmer United Party 1, Katter's Australian Party 1, with 2 independents.[1]
New South Wales
2013 Australian federal election
(New South Wales)|
|
|
|
|
 Results outside Sydney
  Results in Sydney
 |
Turnout 93.33% (CV) — Informal 6.83%[4]
| Party
|
Votes
|
%
|
Swing
|
Seats
|
Change
|
|
|
Coalition
|
|
|
|
|
|
|
|
Liberal
|
1,551,436
|
37.35
|
+0.68
|
23
|
 7 7
|
|
|
National
|
414,772
|
9.99
|
+2.06
|
7
|
3
|
|
|
Labor
|
1,433,842
|
34.52
|
−2.76
|
18
|
 8 8
|
|
|
Greens
|
330,050
|
7.95
|
–2.29
|
|
|
|
|
Palmer United
|
174,551
|
4.20
|
+4.20
|
|
|
|
|
Christian Democrats
|
88,576
|
2.13
|
+0.77
|
|
|
|
|
One Nation
|
19,517
|
0.47
|
–0.01
|
|
|
|
|
Democratic Labour
|
16,909
|
0.41
|
+0.41
|
|
|
|
|
Katter's Australian
|
16,534
|
0.40
|
+0.40
|
|
|
|
|
Bullet Train
|
8,174
|
0.20
|
+0.20
|
|
|
|
|
Australia First
|
6,084
|
0.15
|
+0.07
|
|
|
|
|
Rise Up Australia
|
5,449
|
0.13
|
+0.13
|
|
|
|
|
Citizens Electoral Council
|
4,057
|
0.10
|
+0.07
|
|
|
|
|
Sex Party
|
3,292
|
0.08
|
+0.00
|
|
|
|
|
Stable Population
|
2,245
|
0.05
|
+0.05
|
|
|
|
|
Australian Independents
|
2,092
|
0.05
|
+0.05
|
|
|
|
|
Non-Custodial Parents
|
1,332
|
0.03
|
–0.04
|
|
|
|
|
Socialist Alliance
|
1,229
|
0.03
|
–0.06
|
|
|
|
|
Future
|
693
|
0.02
|
+0.02
|
|
|
|
|
Secular
|
602
|
0.01
|
–0.08
|
|
|
|
|
Australian Voice
|
545
|
0.01
|
+0.01
|
|
|
|
|
Independents
|
71,848
|
1.73
|
−2.58
|
0
|
2
|
| Total
|
4,153,829
|
|
|
48
|
|
| Two-party-preferred vote
|
|
|
Liberal/National Coalition
|
2,257,654
|
54.35
|
+3.19
|
30
|
10
|
|
|
Labor
|
1,896,175
|
45.65
|
–3.19
|
18
|
8
|
Labor to Liberal: Banks, Barton, Eden-Monaro, Lindsay, Reid, Robertson
Labor to National: Page
Independent to Liberal: Dobell (Labor at last election)
Independent to National: Lyne, New England
Victoria
2013 Australian federal election
(Victoria)|
|
|
|
|
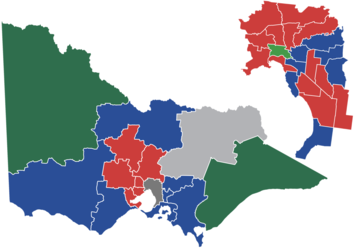 Winning Party by Electorate
  First Preference Vote
 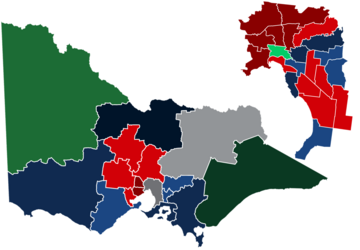 Two-Candidate Preferred Vote
 |
 Electoral divisions: Victoria
 Electoral divisions: Melbourne area
Turnout 93.42% (CV) — Informal 5.19%[5]
| Party
|
Votes
|
%
|
Swing
|
Seats
|
Change
|
|
|
Coalition
|
|
|
|
|
|
|
|
Liberal
|
1,320,417
|
40.08
|
+3.63
|
14
|
2
|
|
|
National
|
86,045
|
2.61
|
–0.58
|
2
|

|
|
|
Labor
|
1,146,894
|
34.81
|
–8.00
|
19
|
3
|
|
|
Greens
|
355,698
|
10.80
|
–1.86
|
1
|
|
|
|
Palmer United
|
119,623
|
3.63
|
+3.63
|
|
|
|
|
Australian Sex Party
|
67,460
|
2.05
|
+1.86
|
|
|
|
|
Family First
|
59,288
|
1.80
|
–1.34
|
|
|
|
|
Rise Up Australia
|
18,124
|
0.55
|
+0.55
|
|
|
|
|
Democratic Labour
|
16,714
|
0.51
|
+0.51
|
|
|
|
|
Australian Christians
|
15,886
|
0.48
|
+0.48
|
|
|
|
|
Katter's Australian
|
15,409
|
0.47
|
+0.47
|
|
|
|
|
Liberal Democrats
|
4,716
|
0.14
|
–0.11
|
|
|
|
|
Country Alliance
|
4,708
|
0.14
|
+0.14
|
|
|
|
|
Animal Justice
|
1,878
|
0.06
|
+0.06
|
|
|
|
|
Bullet Train
|
1,772
|
0.05
|
+0.05
|
|
|
|
|
Socialist Alliance
|
1,703
|
0.05
|
–0.02
|
|
|
|
|
Stable Population
|
856
|
0.03
|
+0.03
|
|
|
|
|
Secular
|
776
|
0.02
|
–0.14
|
|
|
|
|
Citizens Electoral Council
|
557
|
0.03
|
−0.01
|
|
|
|
|
Non-Custodial Parents
|
215
|
0.01
|
+0.01
|
|
|
|
|
Australia First
|
212
|
0.01
|
+0.00
|
|
|
|
|
Senator Online
|
209
|
0.01
|
+0.01
|
|
|
|
|
Australian Independents
|
170
|
0.01
|
+0.01
|
|
|
|
|
Protectionist
|
156
|
0.00
|
+0.00
|
|
|
|
|
Independents
|
53,307
|
1.62
|
+0.79
|
1
|
1
|
|
|
Non Affiliated
|
1,886
|
0.06
|
+0.04
|
|
|
| Total
|
3,294,659
|
|
|
37
|
|
| Two-party-preferred vote
|
|
|
Labor
|
1,653,977
|
50.20
|
−5.11
|
19
|
3
|
|
|
Liberal/National Coalition
|
1,640,682
|
49.80
|
+5.11
|
16
|
2
|
Independents: Cathy McGowan
Labor to Liberal: Corangamite, Deakin, La Trobe
Liberal to Independent: Indi
Queensland
2013 Australian federal election
(Queensland)|
|
|
|
|
First party
|
Second party
|
|
|

|
|
| Leader
|
Tony Abbott
|
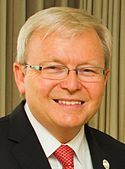
Kevin Rudd
|
| Party
|
Coalition
|
Labor
|
| Last election
|
21 seats
|
8 seats
|
| Seats before
|
21
|
8
|
| Seats won
|
22
|
6
|
| Seat change
|
1
|
2
|
| Popular vote
|
1,152,217
|
751,230
|
| Percentage
|
45.66%
|
29.77%
|
| Swing
|
1.76
|
3.81
|
| TPP
|
56.98%
|
43.02%
|
| TPP swing
|
1.84
|
1.84
|
|
|
|
Third party
|
Fourth party
|
|
|

|
|
| Leader
|
Clive Palmer
|
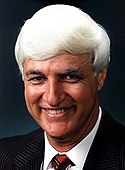
Bob Katter
|
| Party
|
Palmer United
|
Katter's Australian
|
| Last election
|
—
|
—
|
| Seats before
|
0
|
1
|
| Seats won
|
1
|
1
|
| Seat change
|
1
|
|
| Popular vote
|
278,125
|
94,540
|
| Percentage
|
11.02%
|
3.75%
|
| Swing
|
11.02
|
2.15
|
|
 Winning Party by Electorate
  First Preference Vote
  Two-Candidate Preferred Vote
 |
 Electoral divisions: Queensland
 Electoral divisions: Brisbane area
Turnout 93.55% (CV) — Informal 5.13%[6]
| Party
|
Votes
|
%
|
Swing
|
Seats
|
Change
|
|
|
Liberal National
|
1,152,217
|
45.66
|
–1.76
|
22
|
1
|
|
|
Labor
|
751,230
|
29.77
|
–3.81
|
6
|
2
|
|
|
Palmer United
|
278,125
|
11.02
|
+11.02
|
1
|
1
|
|
|
Greens
|
156,884
|
6.22
|
–4.70
|
|
|
|
|
Katter's Australian
|
94,540
|
3.75
|
+2.15
|
1
|
1
|
|
|
Family First
|
51,375
|
2.04
|
–1.85
|
|
|
|
|
Rise Up Australia
|
9,889
|
0.39
|
+0.39
|
|
|
|
|
Australian Sex Party
|
2,859
|
0.11
|
+0.11
|
|
|
|
|
One Nation
|
2,529
|
0.10
|
−0.06
|
|
|
|
|
Citizens Electoral Council
|
2,292
|
0.09
|
+0.03
|
|
|
|
|
Australian Independents
|
1,901
|
0.08
|
+0.08
|
|
|
|
|
Secular
|
1,808
|
0.07
|
+0.05
|
|
|
|
|
Australian Voice
|
1,136
|
0.05
|
+0.05
|
|
|
|
|
Democratic Labour
|
1,075
|
0.04
|
−0.15
|
|
|
|
|
Stable Population
|
729
|
0.03
|
+0.03
|
|
|
|
|
Future
|
481
|
0.02
|
+0.02
|
|
|
|
|
Uniting Australia
|
386
|
0.02
|
+0.02
|
|
|
|
|
Socialist Alliance
|
377
|
0.01
|
−0.02
|
|
|
|
|
Independents
|
10,435
|
0.41
|
−1.48
|
0
|
1
|
|
|
Non Affiliated
|
2,984
|
0.12
|
+0.09
|
|
|
| Total
|
2,523,252
|
|
|
30
|
|
| Two-party-preferred vote
|
|
|
Liberal National
|
1,437,803
|
56.98
|
+1.84
|
22
|
1
|
|
|
Labor
|
1,085,449
|
43.02
|
–1.84
|
6
|
2
|
Labor to LNP: Capricornia, Petrie
LNP to Palmer United: Fairfax
Western Australia
2013 Australian federal election
(Western Australia)|
|
|
|
|
 Results by electorate |
Electoral divisions: Western Australia
Turnout 92.07% (CV) — Informal 5.38%[7]
| Party
|
Votes
|
%
|
Swing
|
Seats
|
Change
|
|
|
Liberal
|
599,153
|
47.31
|
+0.29
|
12
|
1
|
|
|
Labor
|
364,252
|
28.76
|
–2.42
|
3
|
|
|
|
Greens
|
123,370
|
9.74
|
–2.42
|
|
|
|
|
Palmer United
|
67,332
|
5.32
|
+5.32
|
|
|
|
|
National Party (WA)
|
49,430
|
3.90
|
+0.32
|
0
|
1
|
|
|
Australian Christians
|
25,649
|
2.03
|
+2.03
|
|
|
|
|
Family First
|
11,777
|
0.93
|
–0.79
|
|
|
|
|
Rise Up Australia
|
9,153
|
0.72
|
+0.72
|
|
|
|
|
Katter's Australian
|
4,997
|
0.39
|
+0.39
|
|
|
|
|
Australian Sex Party
|
2,236
|
0.18
|
+0.01
|
|
|
|
|
Citizens Electoral Council
|
1,638
|
0.13
|
+0.02
|
|
|
|
|
Australian Sports
|
1,324
|
0.10
|
+0.10
|
|
|
|
|
Democrats
|
1,170
|
0.09
|
+0.09
|
|
|
|
|
Protectionist
|
923
|
0.07
|
+0.07
|
|
|
|
|
Socialist Alliance
|
743
|
0.06
|
−0.05
|
|
|
|
|
Independents
|
3,357
|
0.27
|
–0.15
|
|
|
| Total
|
1,266,504
|
|
|
15
|
|
| Two-party-preferred vote
|
|
|
Liberal/National Coalition
|
738,110
|
58.28
|
+1.87
|
12
|
1
|
|
|
Labor
|
528,394
|
41.72
|
–1.87
|
3
|
|
WA National to Liberal: O'Connor
South Australia
 Electoral divisions: South Australia
Turnout 93.47% (CV) — Informal 4.85%[8]
| Party
|
Votes
|
%
|
Swing
|
Seats
|
Change
|
|
|
Liberal
|
447,286
|
44.49
|
+4.28
|
6
|
1
|
|
|
Labor
|
359,273
|
35.73
|
–5.01
|
5
|
1
|
|
|
Greens
|
83,252
|
8.28
|
–3.70
|
|
|
|
|
Family First
|
54,409
|
5.41
|
+0.45
|
|
|
|
|
Palmer United
|
37,981
|
3.78
|
+3.78
|
|
|
|
|
National Party (SA)
|
4,021
|
0.40
|
+0.40
|
|
|
|
|
Katter's Australian
|
2,268
|
0.23
|
+0.23
|
|
|
|
|
Rise Up Australia
|
1,191
|
0.12
|
+0.12
|
|
|
|
|
Australia First
|
1,116
|
0.11
|
+0.11
|
|
|
|
|
Socialist Alliance
|
980
|
0.10
|
+0.02
|
|
|
|
|
Democratic Labour
|
834
|
0.08
|
+0.08
|
|
|
|
|
Independents
|
12,834
|
1.28
|
+0.76
|
|
|
| Total
|
1,005,445
|
|
|
11
|
|
| Two-party-preferred vote
|
|
|
Liberal/National Coalition
|
526,493
|
52.36
|
+5.54
|
6
|
1
|
|
|
Labor
|
478,952
|
47.64
|
–5.54
|
5
|
1
|
Labor to Liberal: Hindmarsh
Tasmania
2013 Australian federal election
(Tasmania)|
|
|
|
|
First party
|
Second party
|
|
|
|

|
| Leader
|
Tony Abbott
|
Kevin Rudd
|
| Party
|
Liberal
|
Labor
|
| Last election
|
0 seats
|
4 seats
|
| Seats won
|
3 seats
|
1 seat
|
| Seat change
|
3
|
3
|
| Popular vote
|
132,961
|
114,977
|
| Percentage
|
40.26%
|
34.81%
|
| Swing
|
6.66
|
9.14
|
| TPP
|
48.77%
|
51.23%
|
| TPP swing
|
9.39
|
9.39
|
|
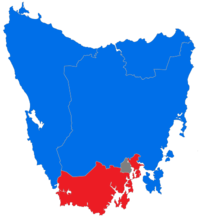 |
 Electoral divisions: Tasmania
Turnout 94.78% (CV) — Informal 4.04%[9]
| Party
|
Votes
|
%
|
Swing
|
Seats
|
Change
|
|
|
Liberal
|
132,961
|
40.26
|
+6.66
|
3
|
3
|
|
|
Labor
|
114,977
|
34.81
|
–9.14
|
1
|
3
|
|
|
Greens
|
27,467
|
8.32
|
–8.50
|
|
|
|
|
Palmer United
|
20,026
|
6.06
|
+6.06
|
|
|
|
|
Family First
|
4,971
|
1.51
|
+1.51
|
|
|
|
|
Rise Up Australia
|
1,824
|
0.55
|
+0.55
|
|
|
|
|
Australian Christians
|
963
|
0.29
|
+0.29
|
|
|
|
|
Australian Sex Party
|
877
|
0.27
|
+0.27
|
|
|
|
|
Democratic Labour
|
554
|
0.17
|
+0.17
|
|
|
|
|
Katter's Australian
|
478
|
0.14
|
+0.14
|
|
|
|
|
Secular
|
384
|
0.12
|
–0.21
|
|
|
|
|
Stable Population
|
124
|
0.04
|
+0.04
|
|
|
|
|
Independents
|
24,688
|
7.47
|
+2.69
|
1
|
|
| Total
|
330,294
|
|
|
5
|
|
| Two-party-preferred vote
|
|
|
Labor
|
169,208
|
51.23
|
–9.39
|
1
|
3
|
|
|
Liberal/National Coalition
|
161,086
|
48.77
|
+9.39
|
3
|
3
|
Independents: Andrew Wilkie
Labor to Liberal: Bass, Braddon, Lyons


.svg)


.png)
.png)


